

Overview
The Scenario
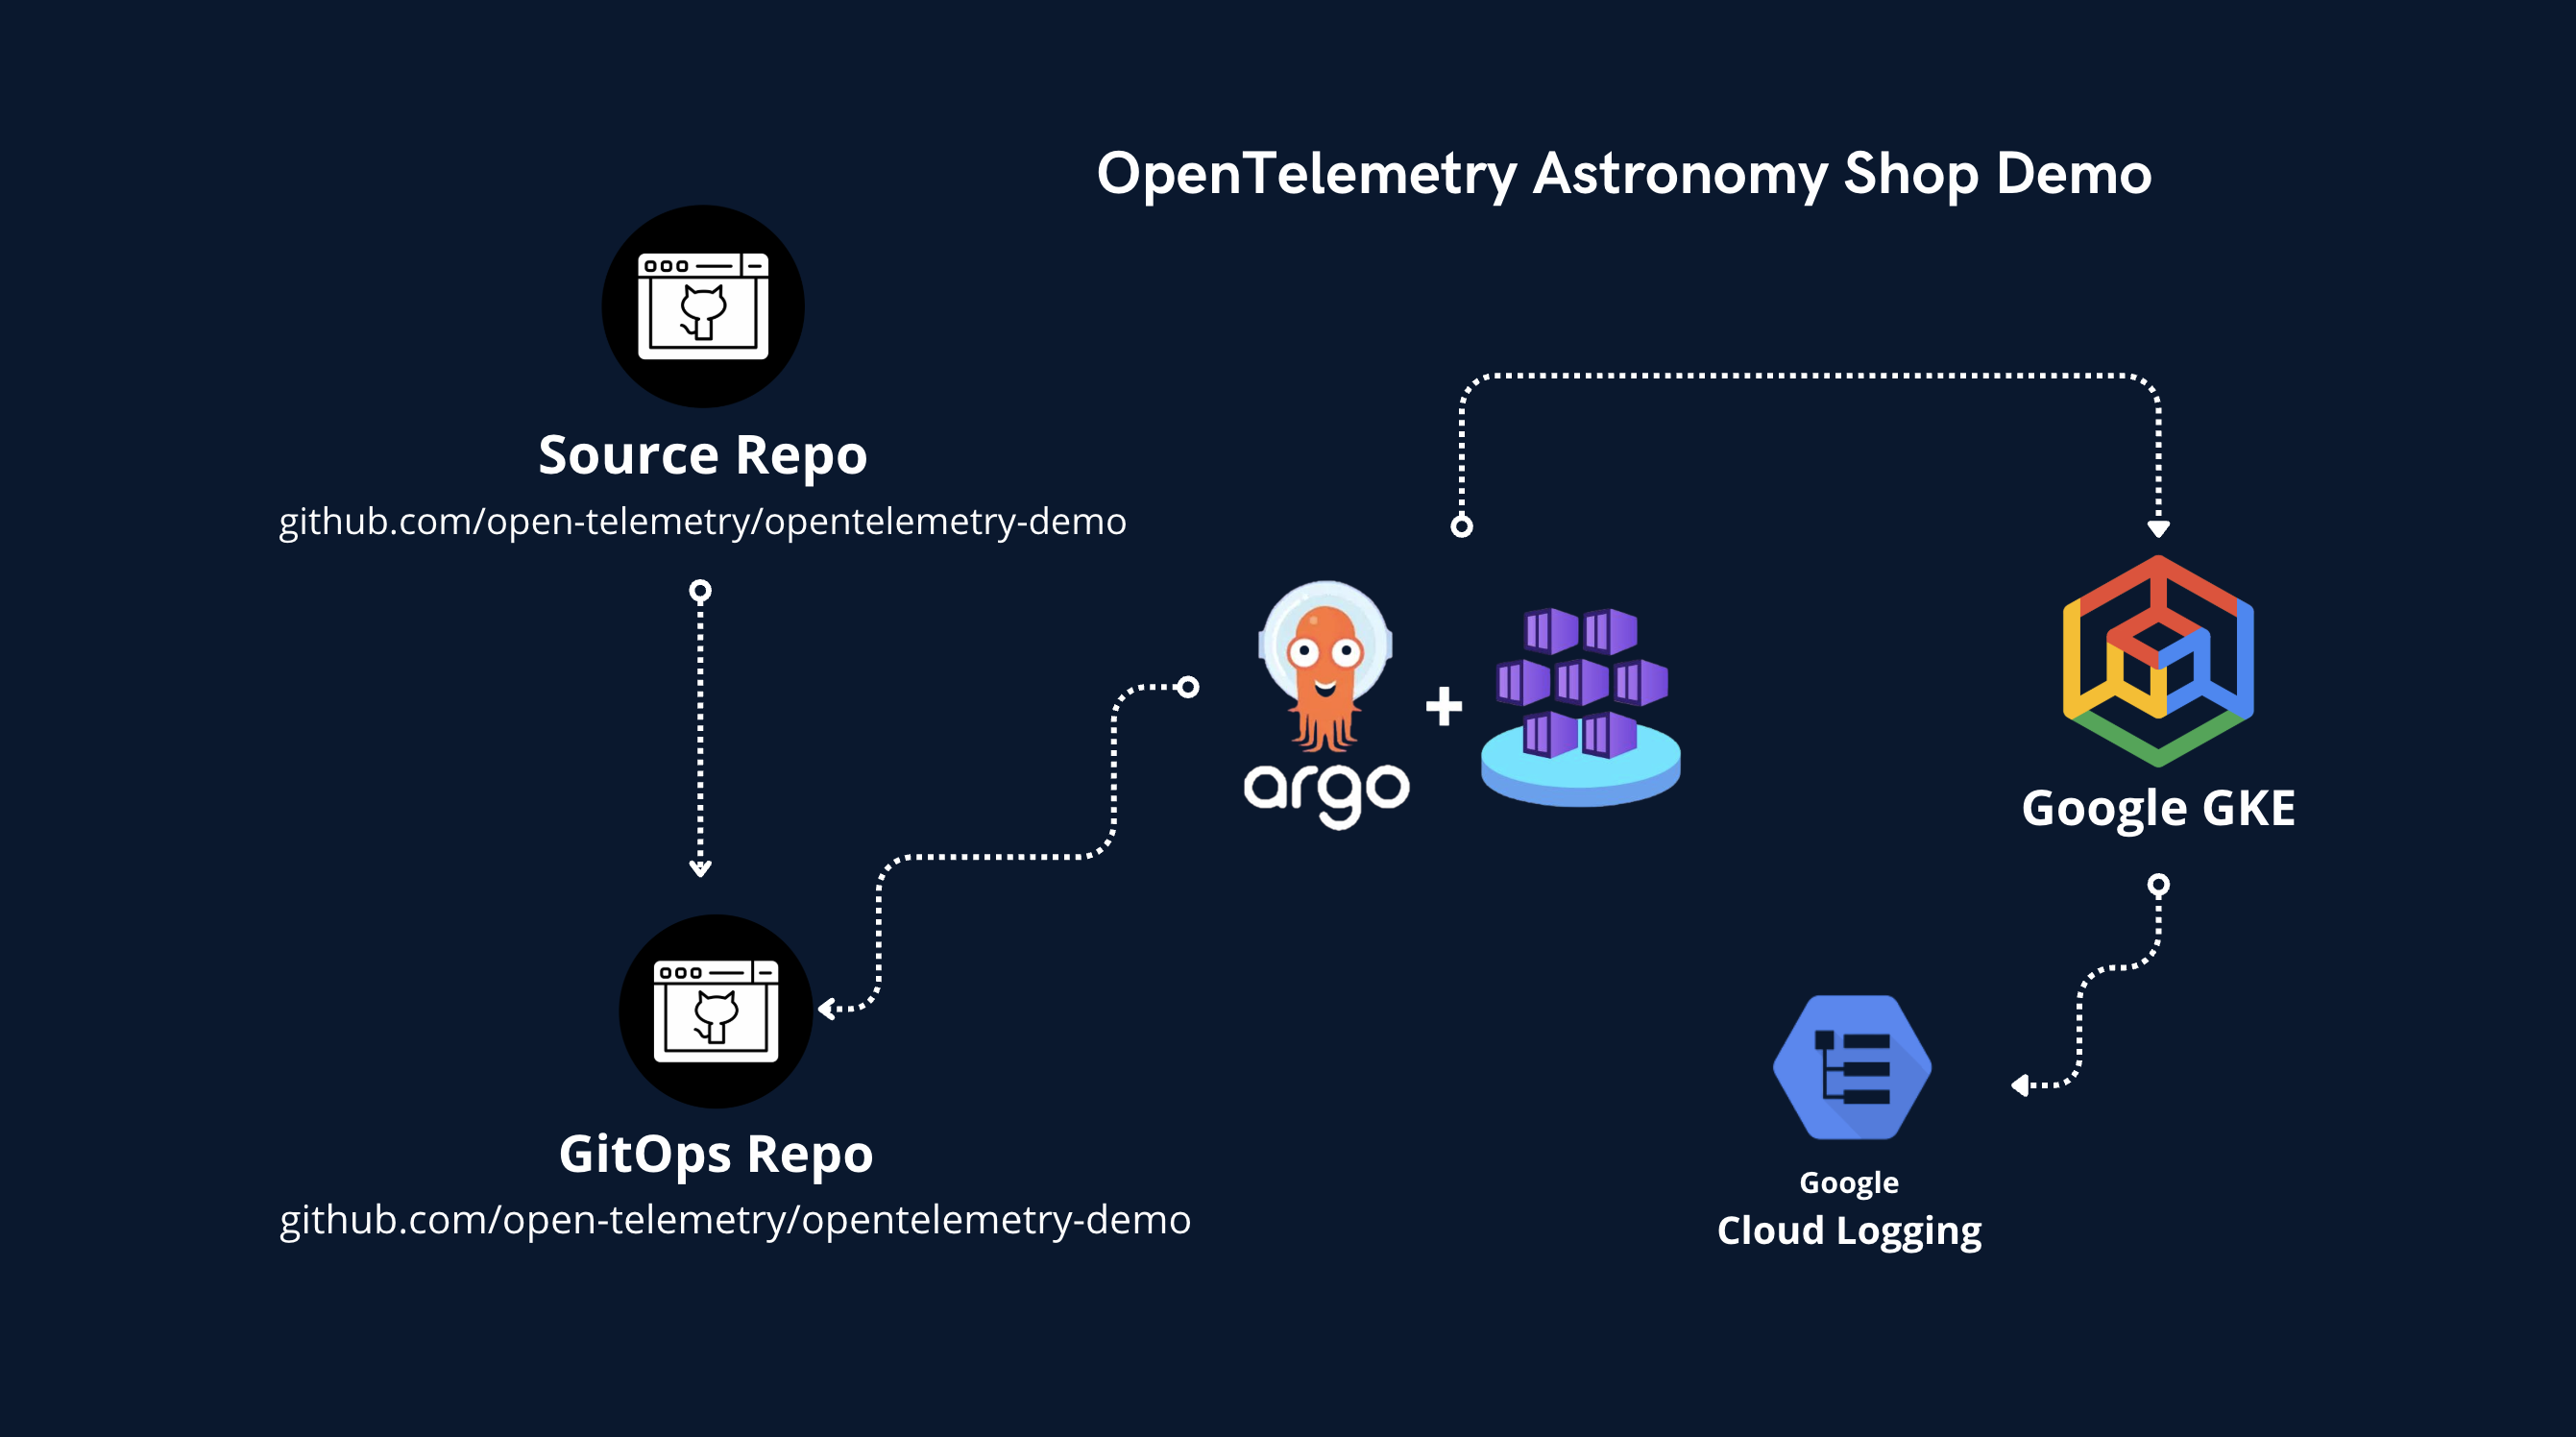
The OpenTelemetry Astronomy Shop is a microservices-based application intended to illustrate the use of OpenTelemetry. It consists of over a dozen microservices written in different languages (Go, Java, Python, .NET, etc.) communicating via gRPC and HTTP. We have deployed this application to a GKE Autopilot cluster to simulate a realistic production environment where infrastructure constraints (like resource quotas) can impact application stability.Repository Structure
To manage this deployment and enable WHAWIT’s intelligent analysis, we use two GitHub repositories:1. Infrastructure Repository (whawit-demos/opentelemetry-demo-codeops)
View on GitHub
This repository contains the Infrastructure as Code (IaC) and deployment configurations.
- Terraform: Defines the GKE cluster, VPCs, and networking.
- Helm: Contains the
opentelemetry-demochart and values files defining resource limits (LimitRange), quotas (ResourceQuota), and scaling settings. - ArgoCD: (Optional) GitOps configurations.
2. Application Repository (whawit-demos/opentelemetry-demo)
View on GitHub
This repository contains the source code for the microservices.
- Business Logic: The actual code for
frontend,cartservice,checkoutservice, etc. - Instrumentation: OpenTelemetry SDK setup.
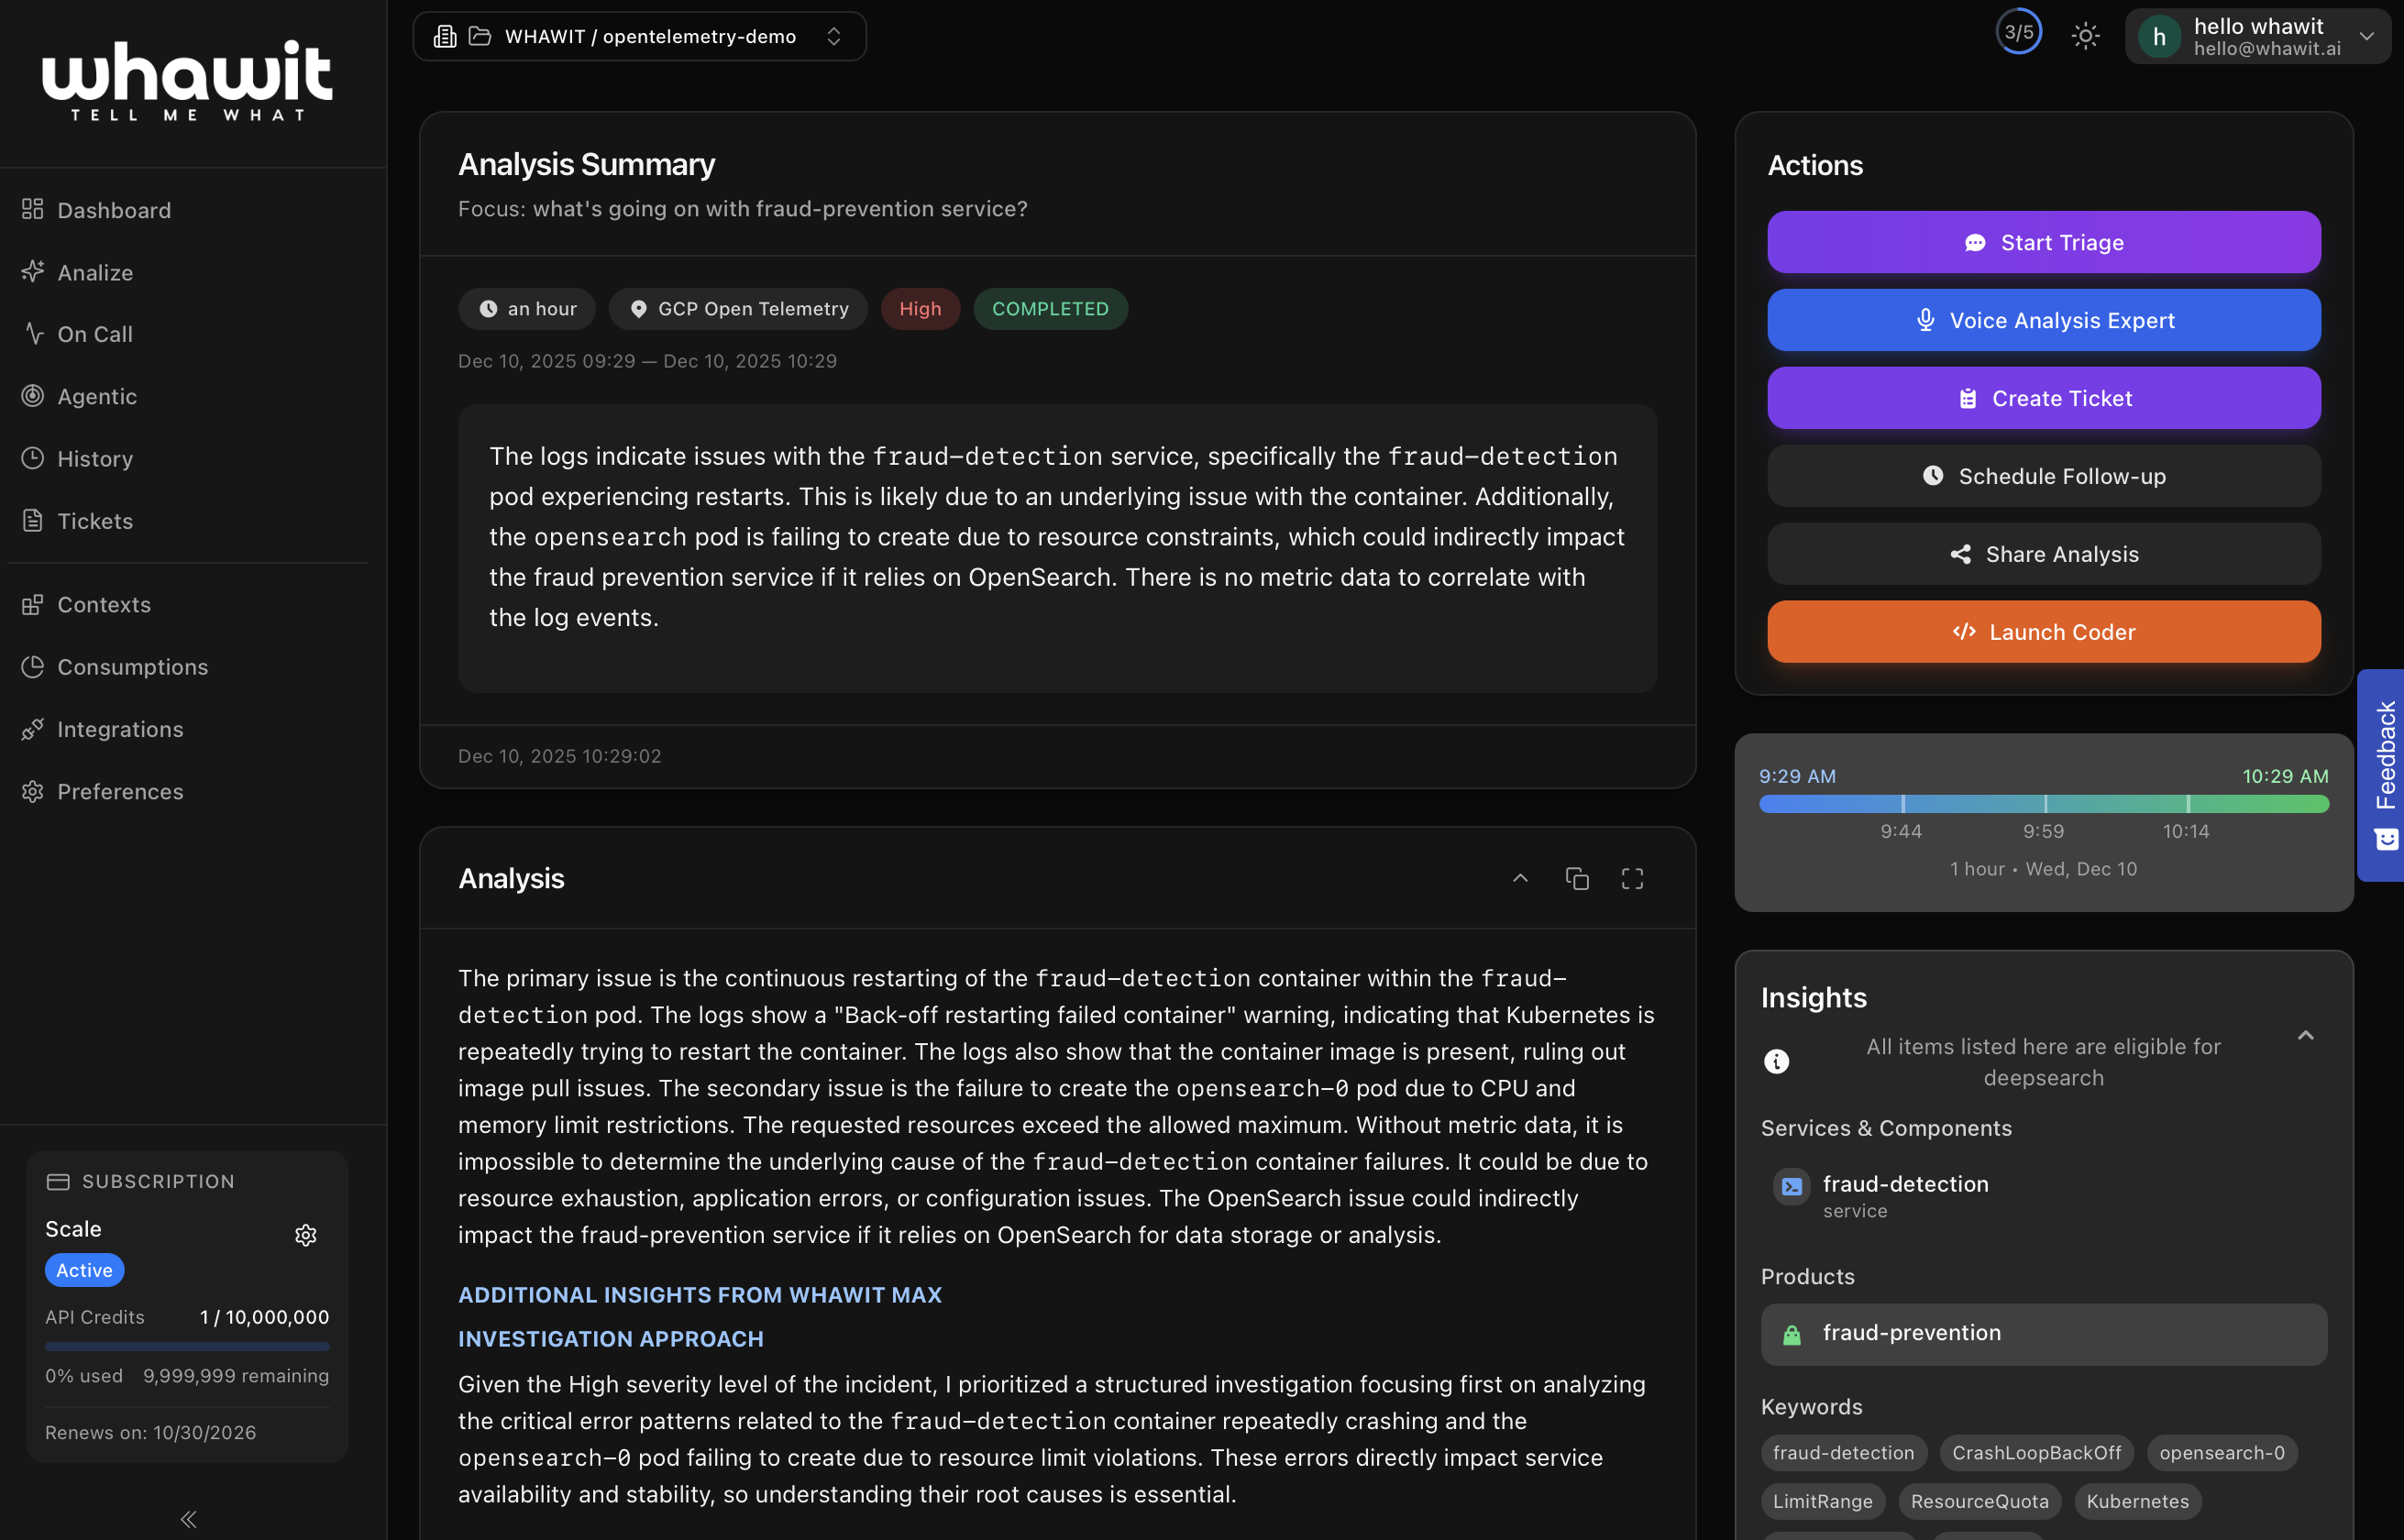
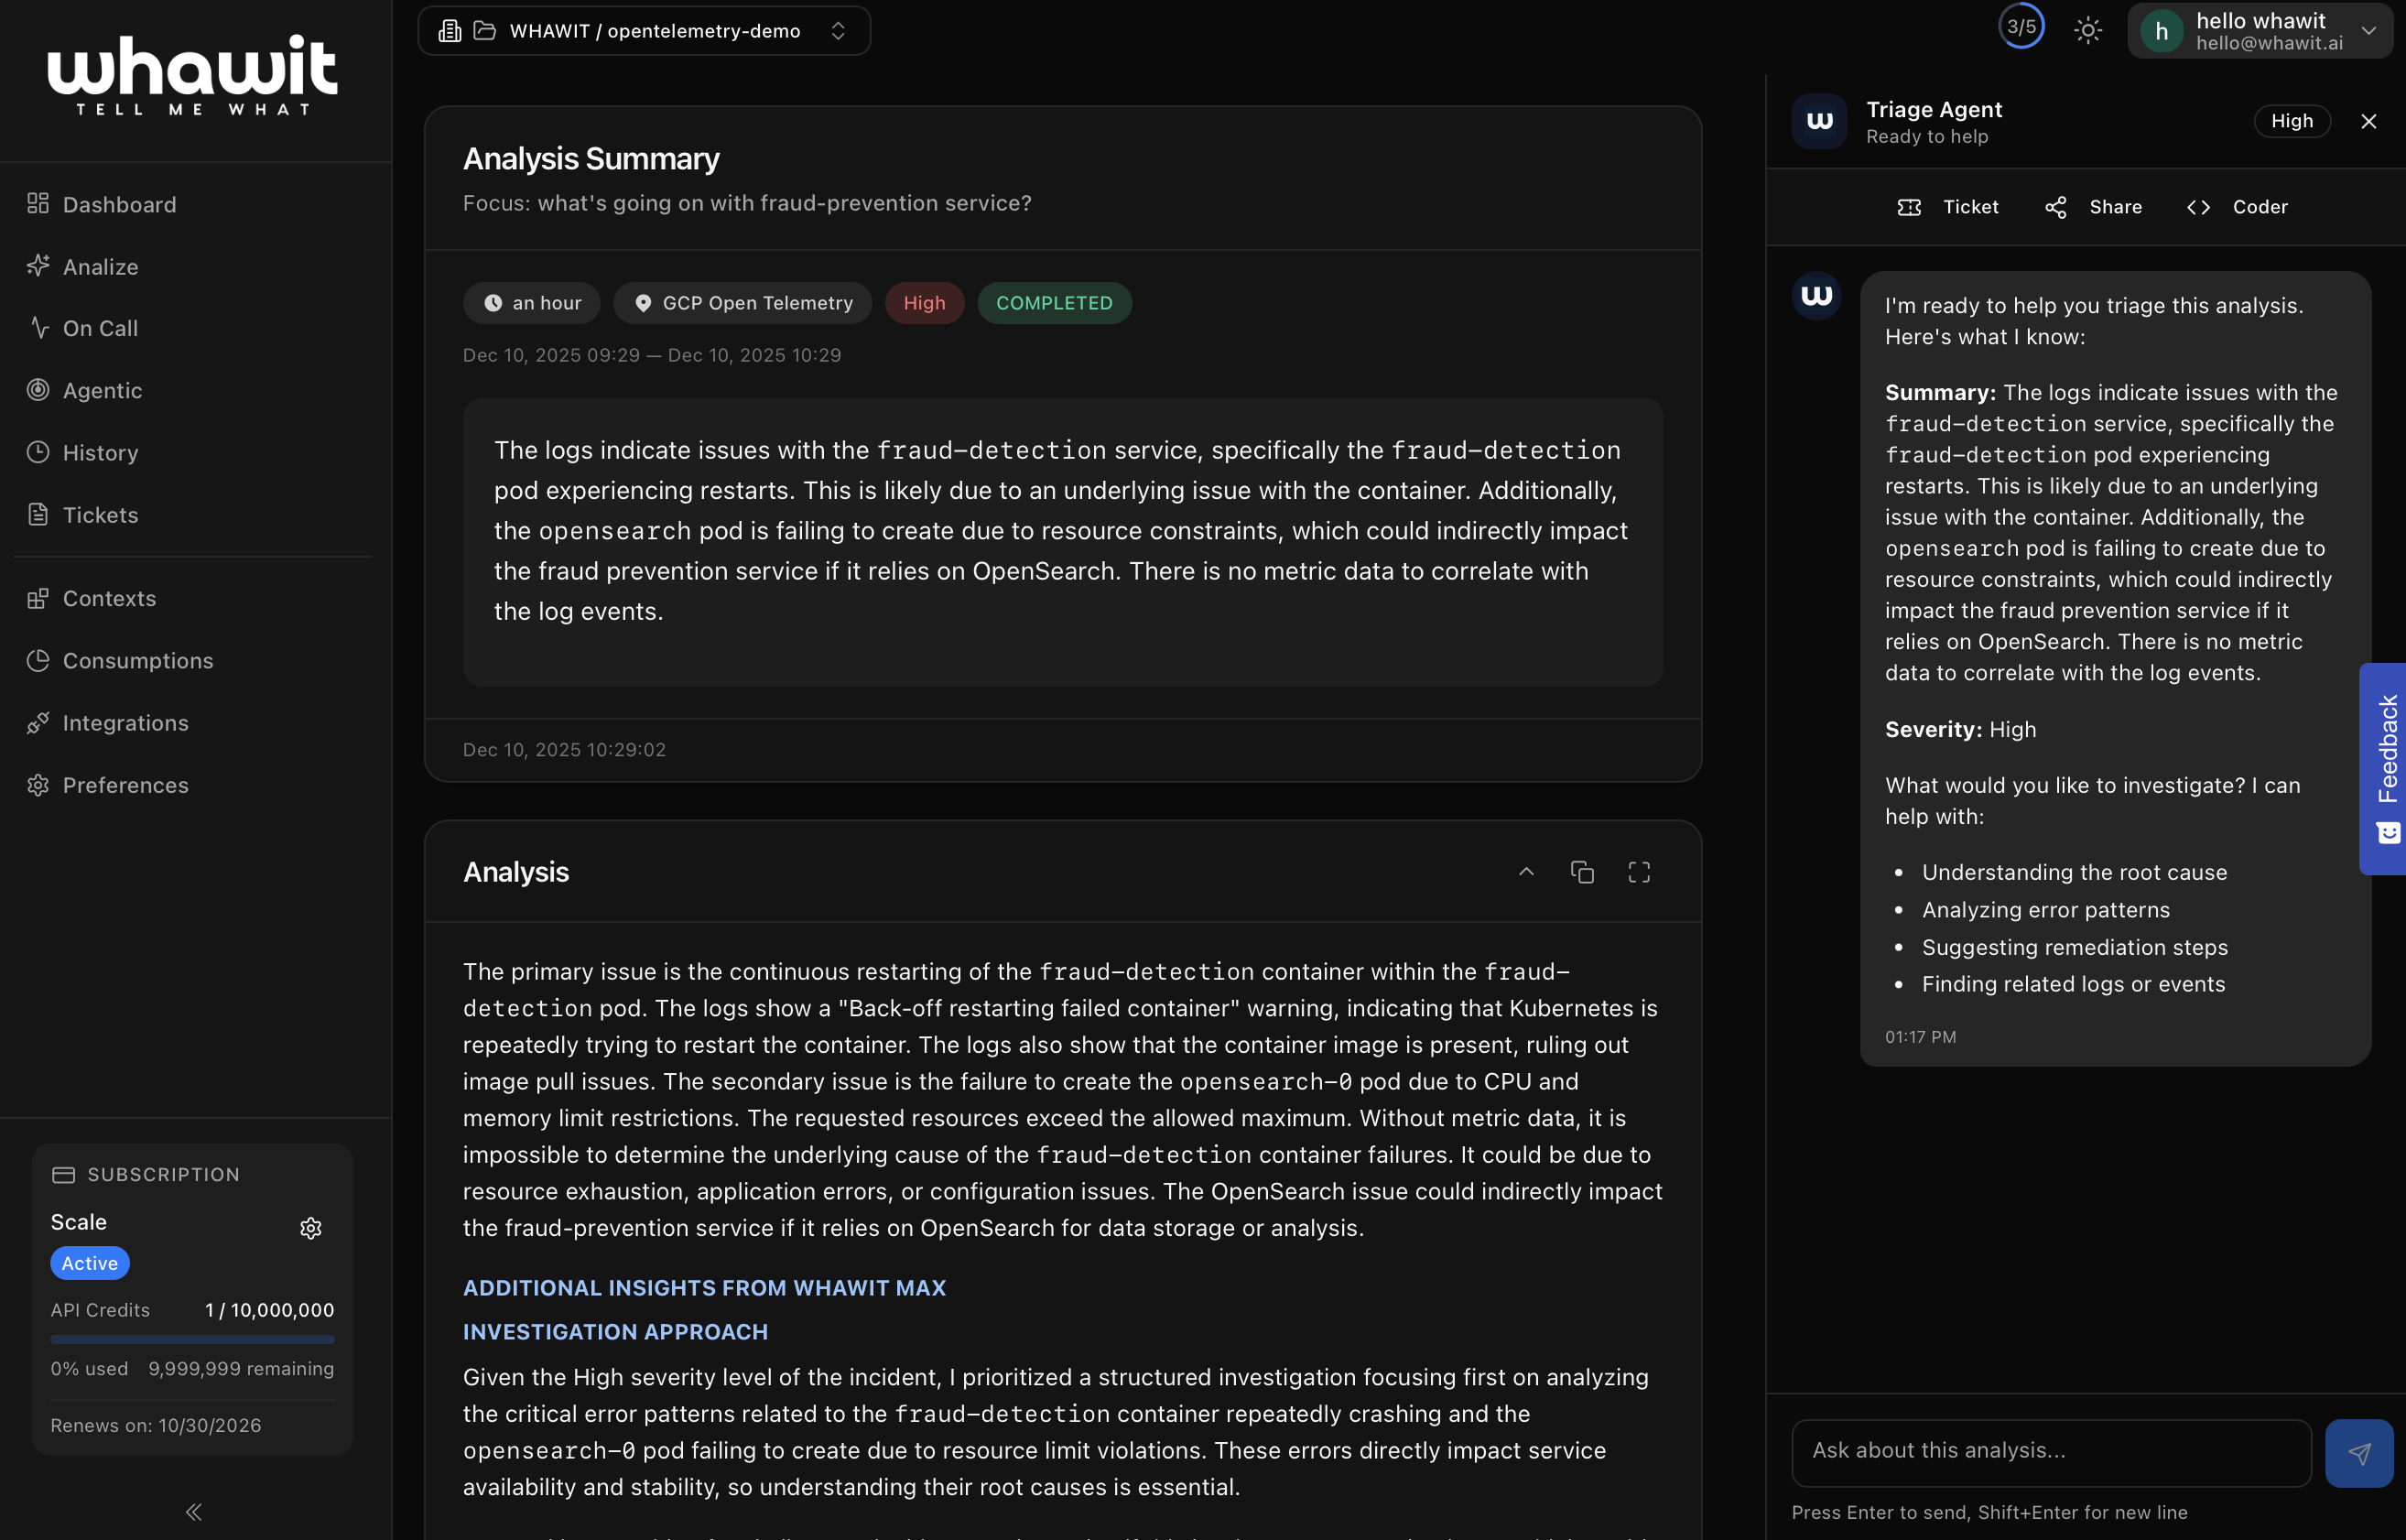
Troubleshooting with WHAWIT
WHAWIT acts as an Intelligence Layer on top of your existing observability stack (Google Cloud Logging and Managed Prometheus in this case).1. Detection
WHAWIT continuously ingests logs and metrics. In this scenario, it detects aCrashLoopBackOff event for the fraud-detection service.
2. Correlation
WHAWIT analyzes the telemetry and correlates it with the connected repositories.- It identifies the
fraud-detectionservice is failing. - It scans the
codeopsrepository and findsLimitRangeandResourceQuotadefinitions in thehelm/directory. - It recognizes that the error messages in the logs (e.g., “exceeded quota”) match the constraints defined in the infrastructure code.
3. Analysis
Instead of just alerting “Pod Failed”, WHAWIT provides a comprehensive analysis:- Root Cause: The pod is failing to start because the namespace has hit its ResourceQuota limits for CPU/Memory.
- Evidence: Cites the specific log entries from GCP and the configuration files from the
codeopsrepo. - Recommendation: Suggests increasing the quota in the
namespaces.tfor Helm values, or optimizing the resource requests of thefraud-detectionservice.
Integration with Datadog
While the example above uses Google Cloud Logging and Managed Prometheus, WHAWIT integrates equally well with Datadog for the same OpenTelemetry demo.1. Setup Changes
In a Datadog-integrated environment, the observability data flow changes slightly:- Datadog Agent: Deployed as a DaemonSet on the GKE cluster to collect logs, metrics, and traces.
- OpenTelemetry Collector: Configured to export traces and OTLP metrics to the Datadog Agent or directly to Datadog’s backend.
2. WHAWIT Configuration
To enable this integration in WHAWIT:- Go to Integrations and select Datadog.
- Provide your Datadog API Key and Application Key.
- WHAWIT will begin indexing alerts, events, and relevant telemetry from Datadog.
3. The WHAWIT Advantage
Even with Datadog, the Correlation and Analysis steps remain powered by WHAWIT’s unique engine:- Alert Ingestion: WHAWIT receives a monitor alert from Datadog (e.g., “High Error Rate on
frontend”). - Deep Linking: The WHAWIT incident summary provides direct links back to your Datadog dashboards and notebooks.
- Repo Connection: WHAWIT still connects to
whawit-demos/opentelemetry-demoto find the code causing the errors, enriching the Datadog alert with root cause analysis that points to specific commits or config files.