

Features
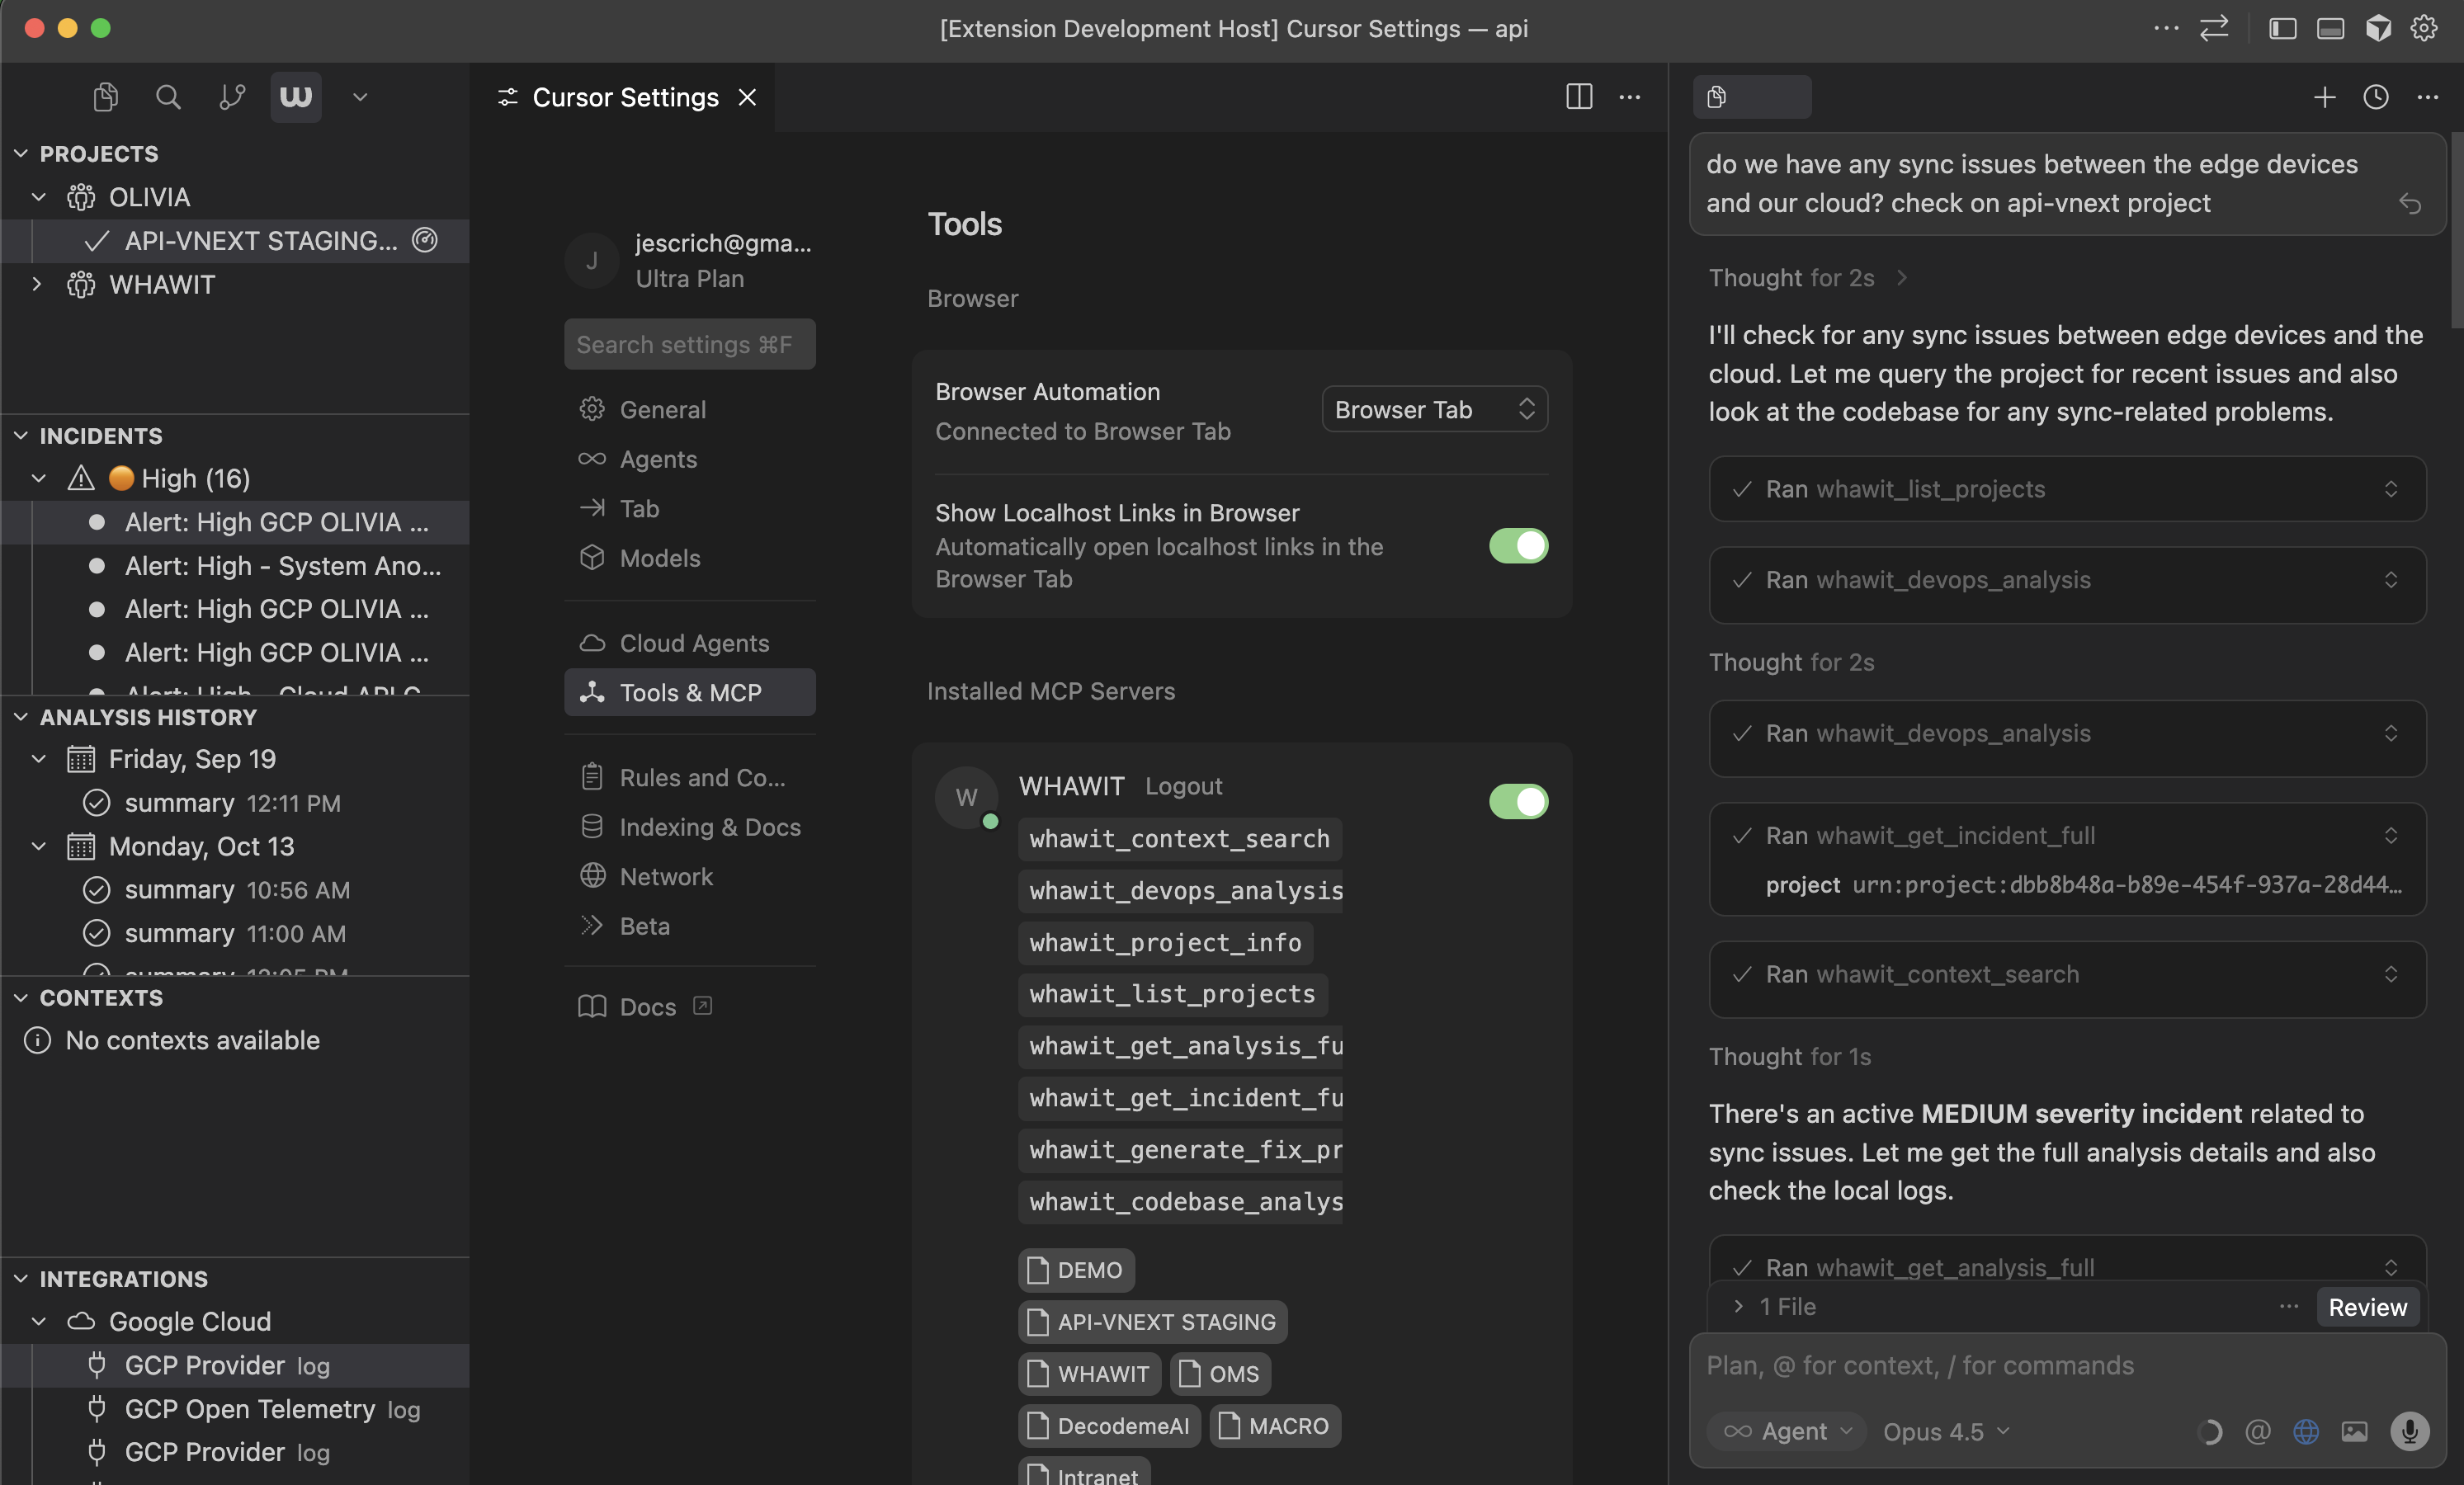
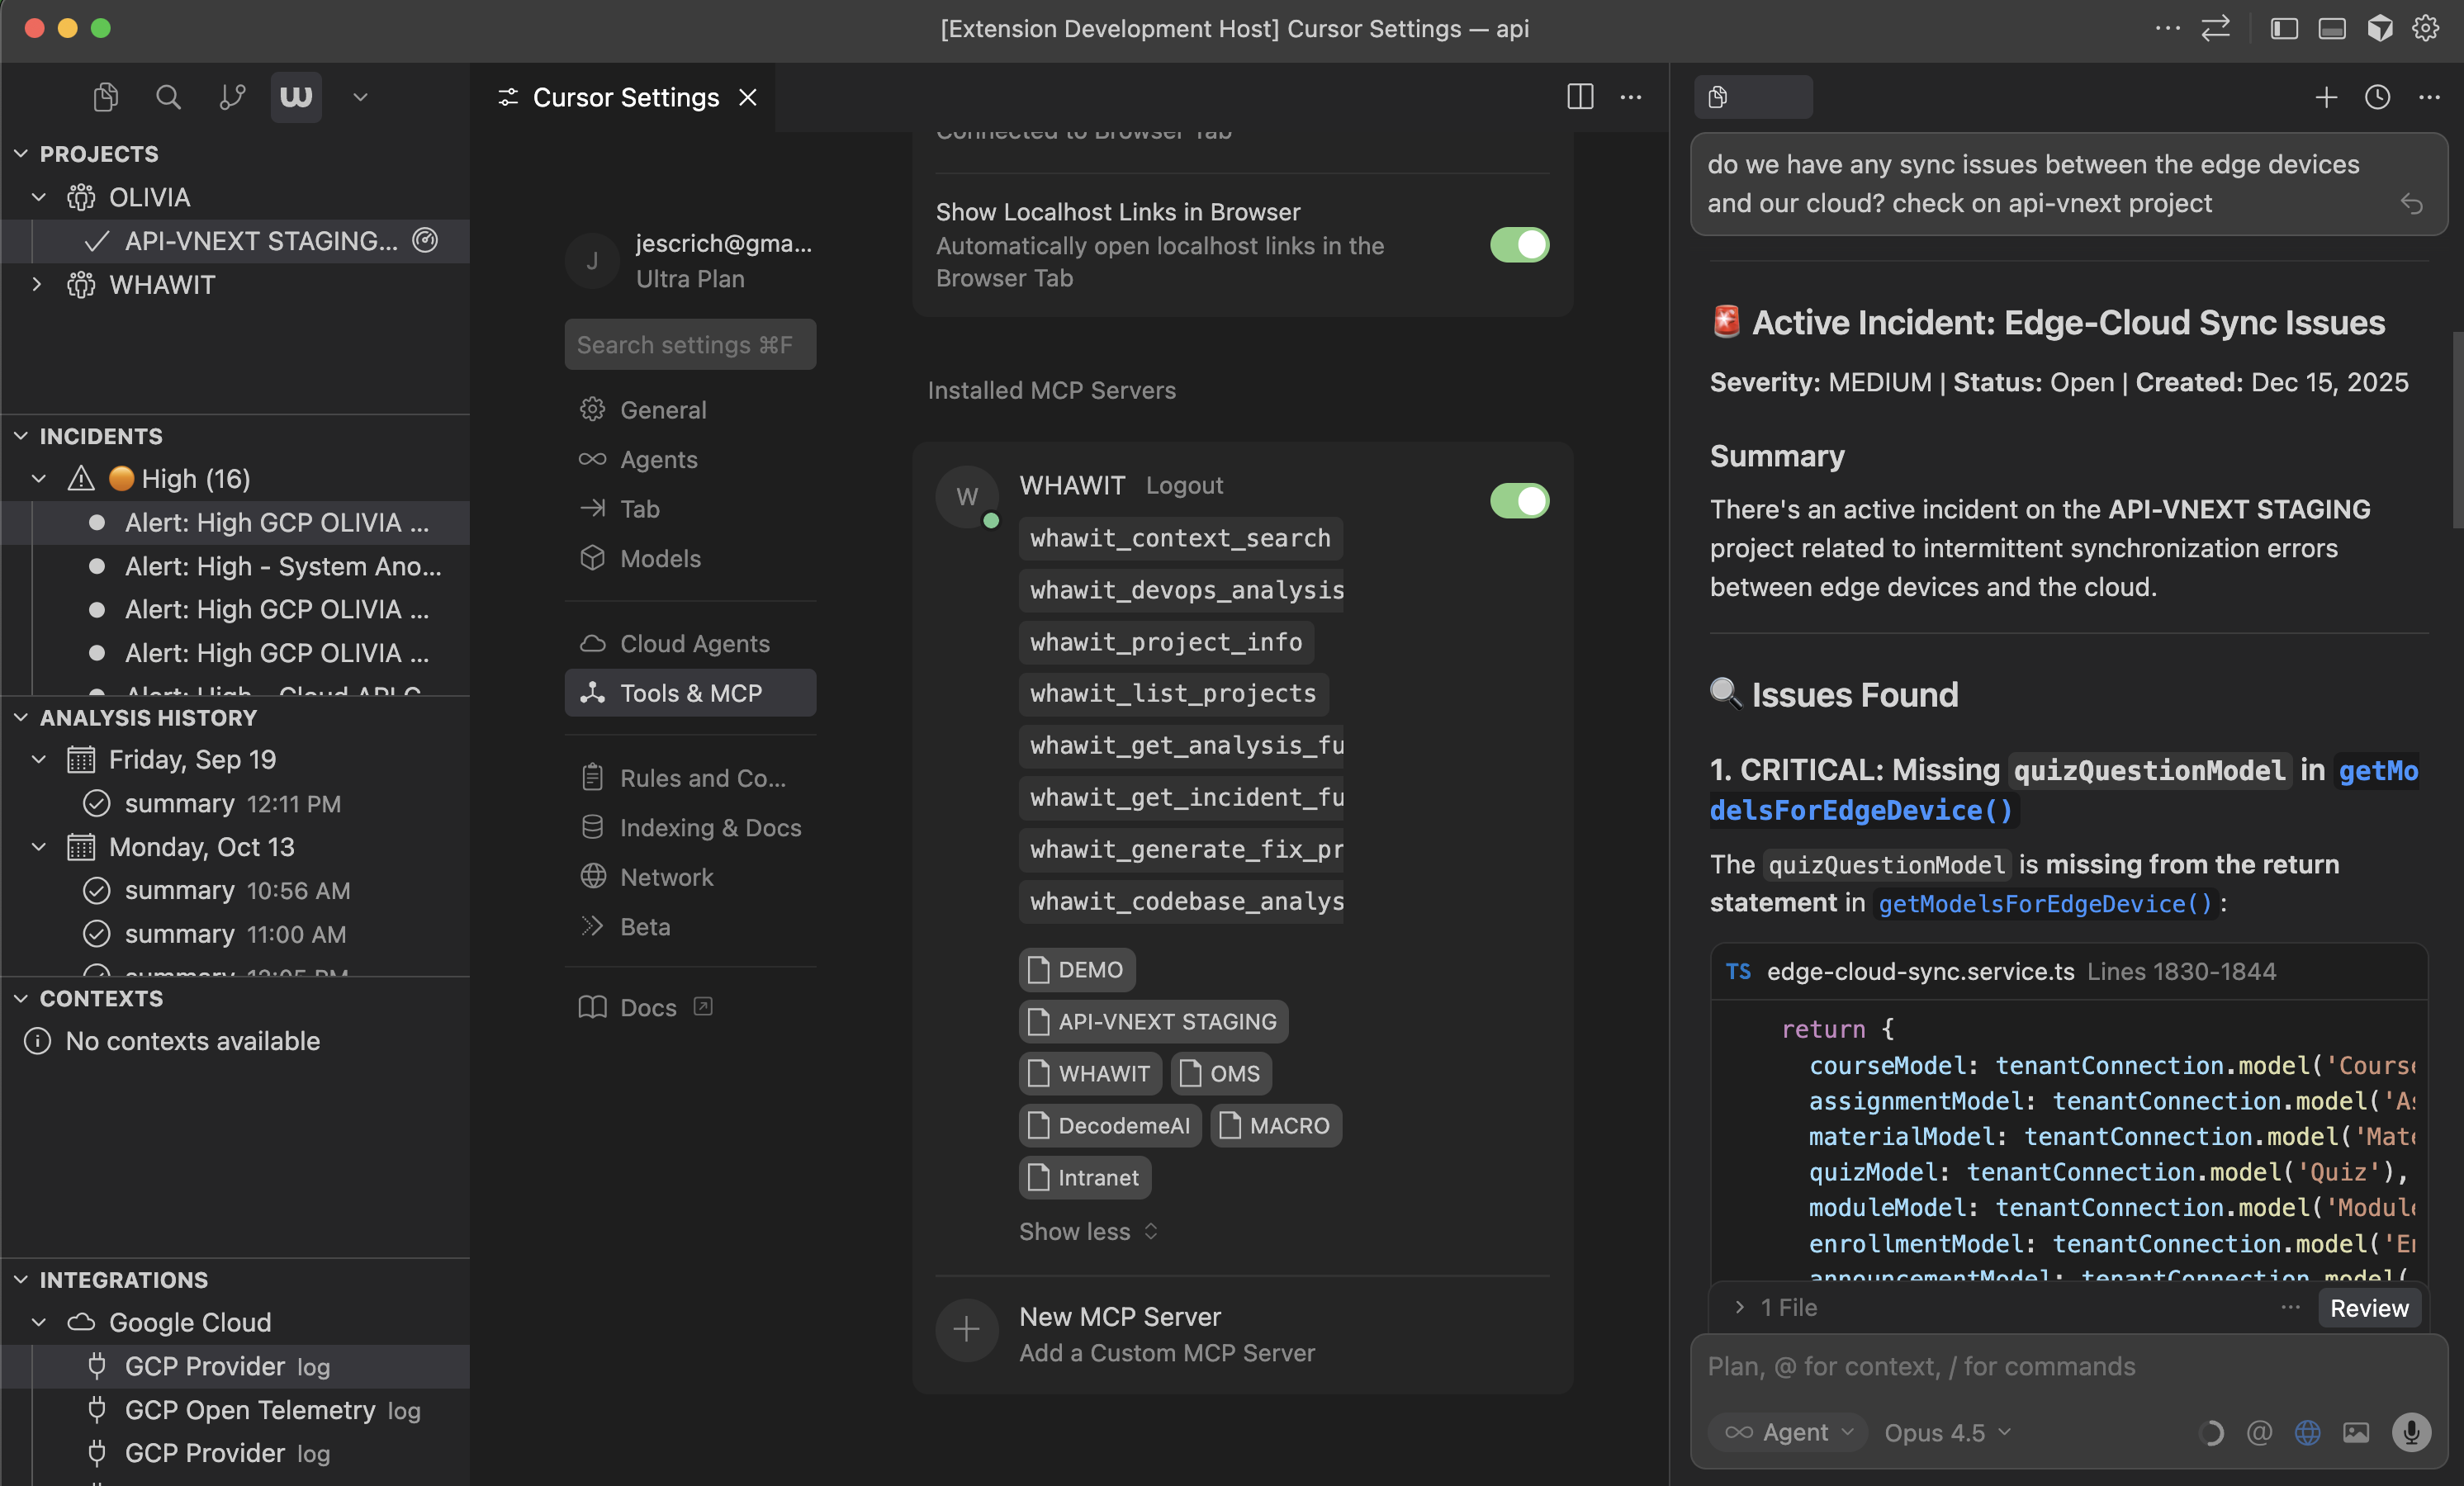
Radar Chat
Ask natural language questions about your logs, metrics, and system health directly in the editor.
Context Search
Search your project’s knowledge base for architecture documentation, runbooks, and technical context.
Auto-detect Projects
Automatically matches your workspace to Whawit projects based on Git remotes.
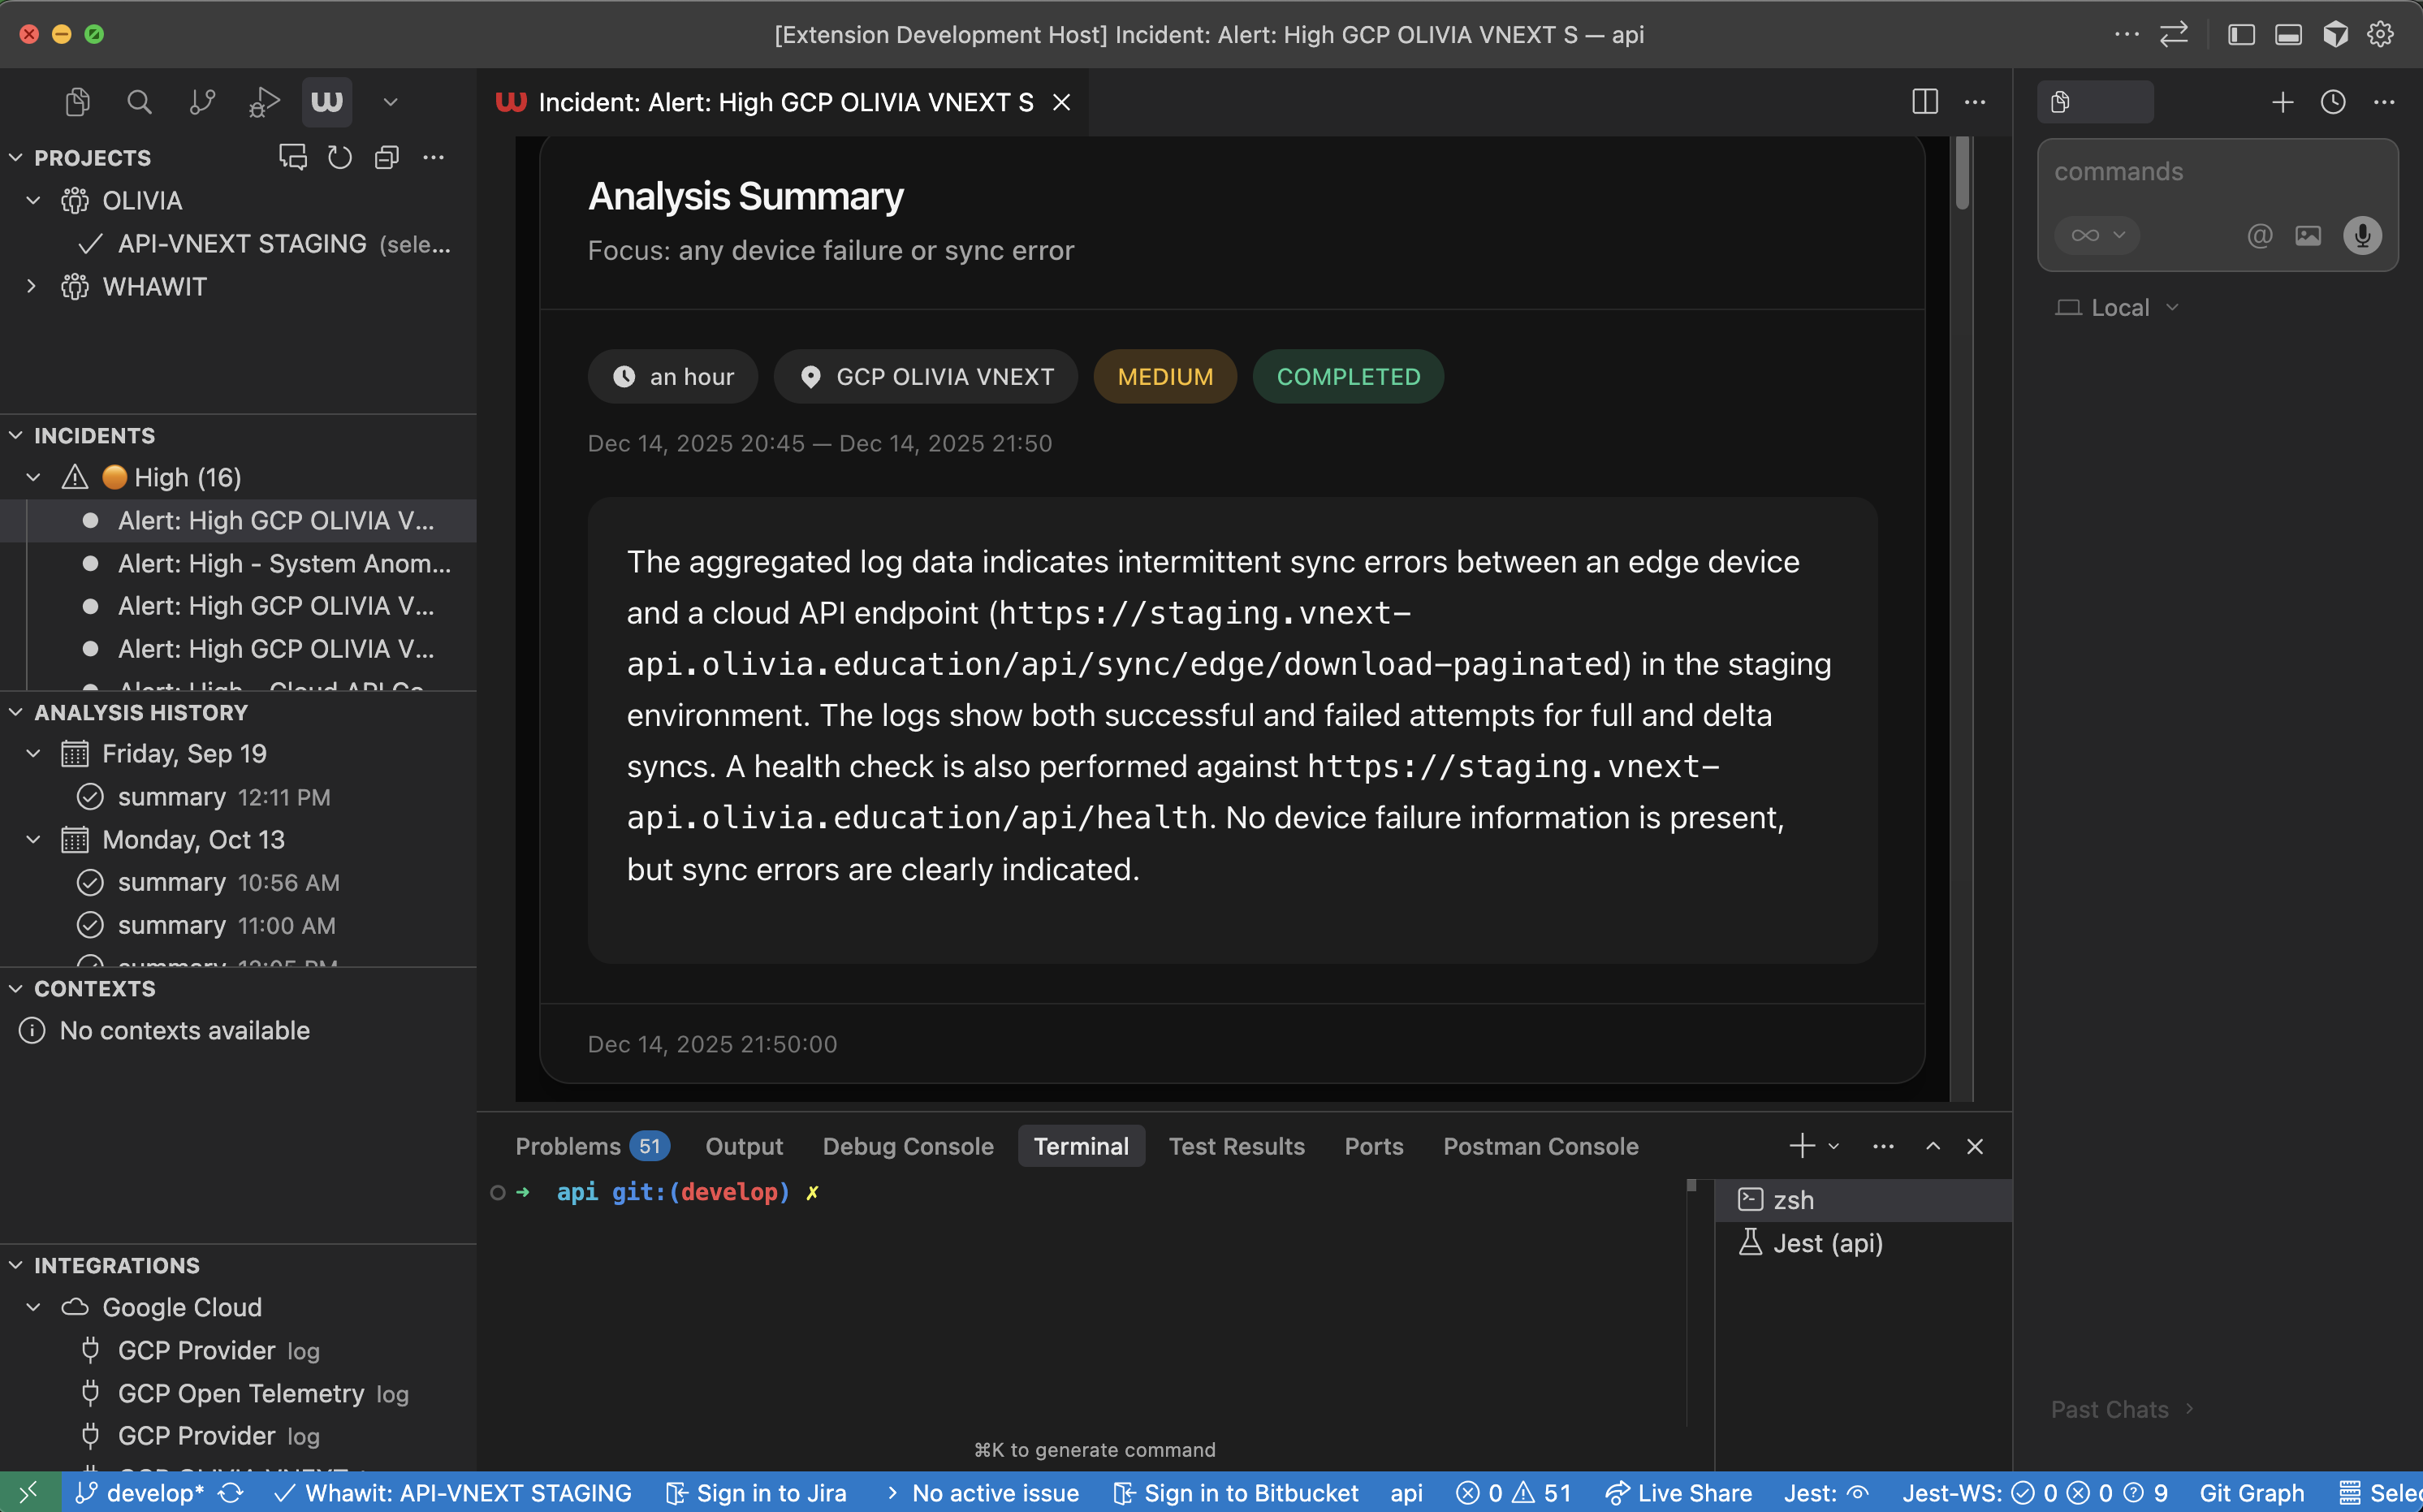
Incident Management
View and manage incidents from connected observability providers without leaving your editor.
Prerequisites
- VS Code 1.90.0 or later (also compatible with Cursor, Windsurf, and Kiro)
- A Whawit account (sign up at whawit.ai)
- At least one project configured in Whawit with connected observability providers
Installation
- Open VS Code
- Go to Extensions (
Ctrl+Shift+XorCmd+Shift+X) - Search for Whawit
- Click Install
The Whawit icon appears in your Activity Bar after installation.
Getting Started
Login to Whawit
Click the Whawit icon in the Activity Bar, then click Login to Whawit.The extension uses Auth0 for authentication. A browser window opens for you to complete the sign-in flow.
Select or auto-detect your project
If
whawit.autoDetectProject is enabled (default), the extension automatically matches your workspace to a Whawit project based on Git remotes.To manually select a project:- Open the Command Palette (
Ctrl+Shift+PorCmd+Shift+P) - Run Whawit: Select Project
- Choose from the list of available projects
The status bar shows your current project name when connected.
Activity Bar Views
The Whawit sidebar contains five views for managing your observability data: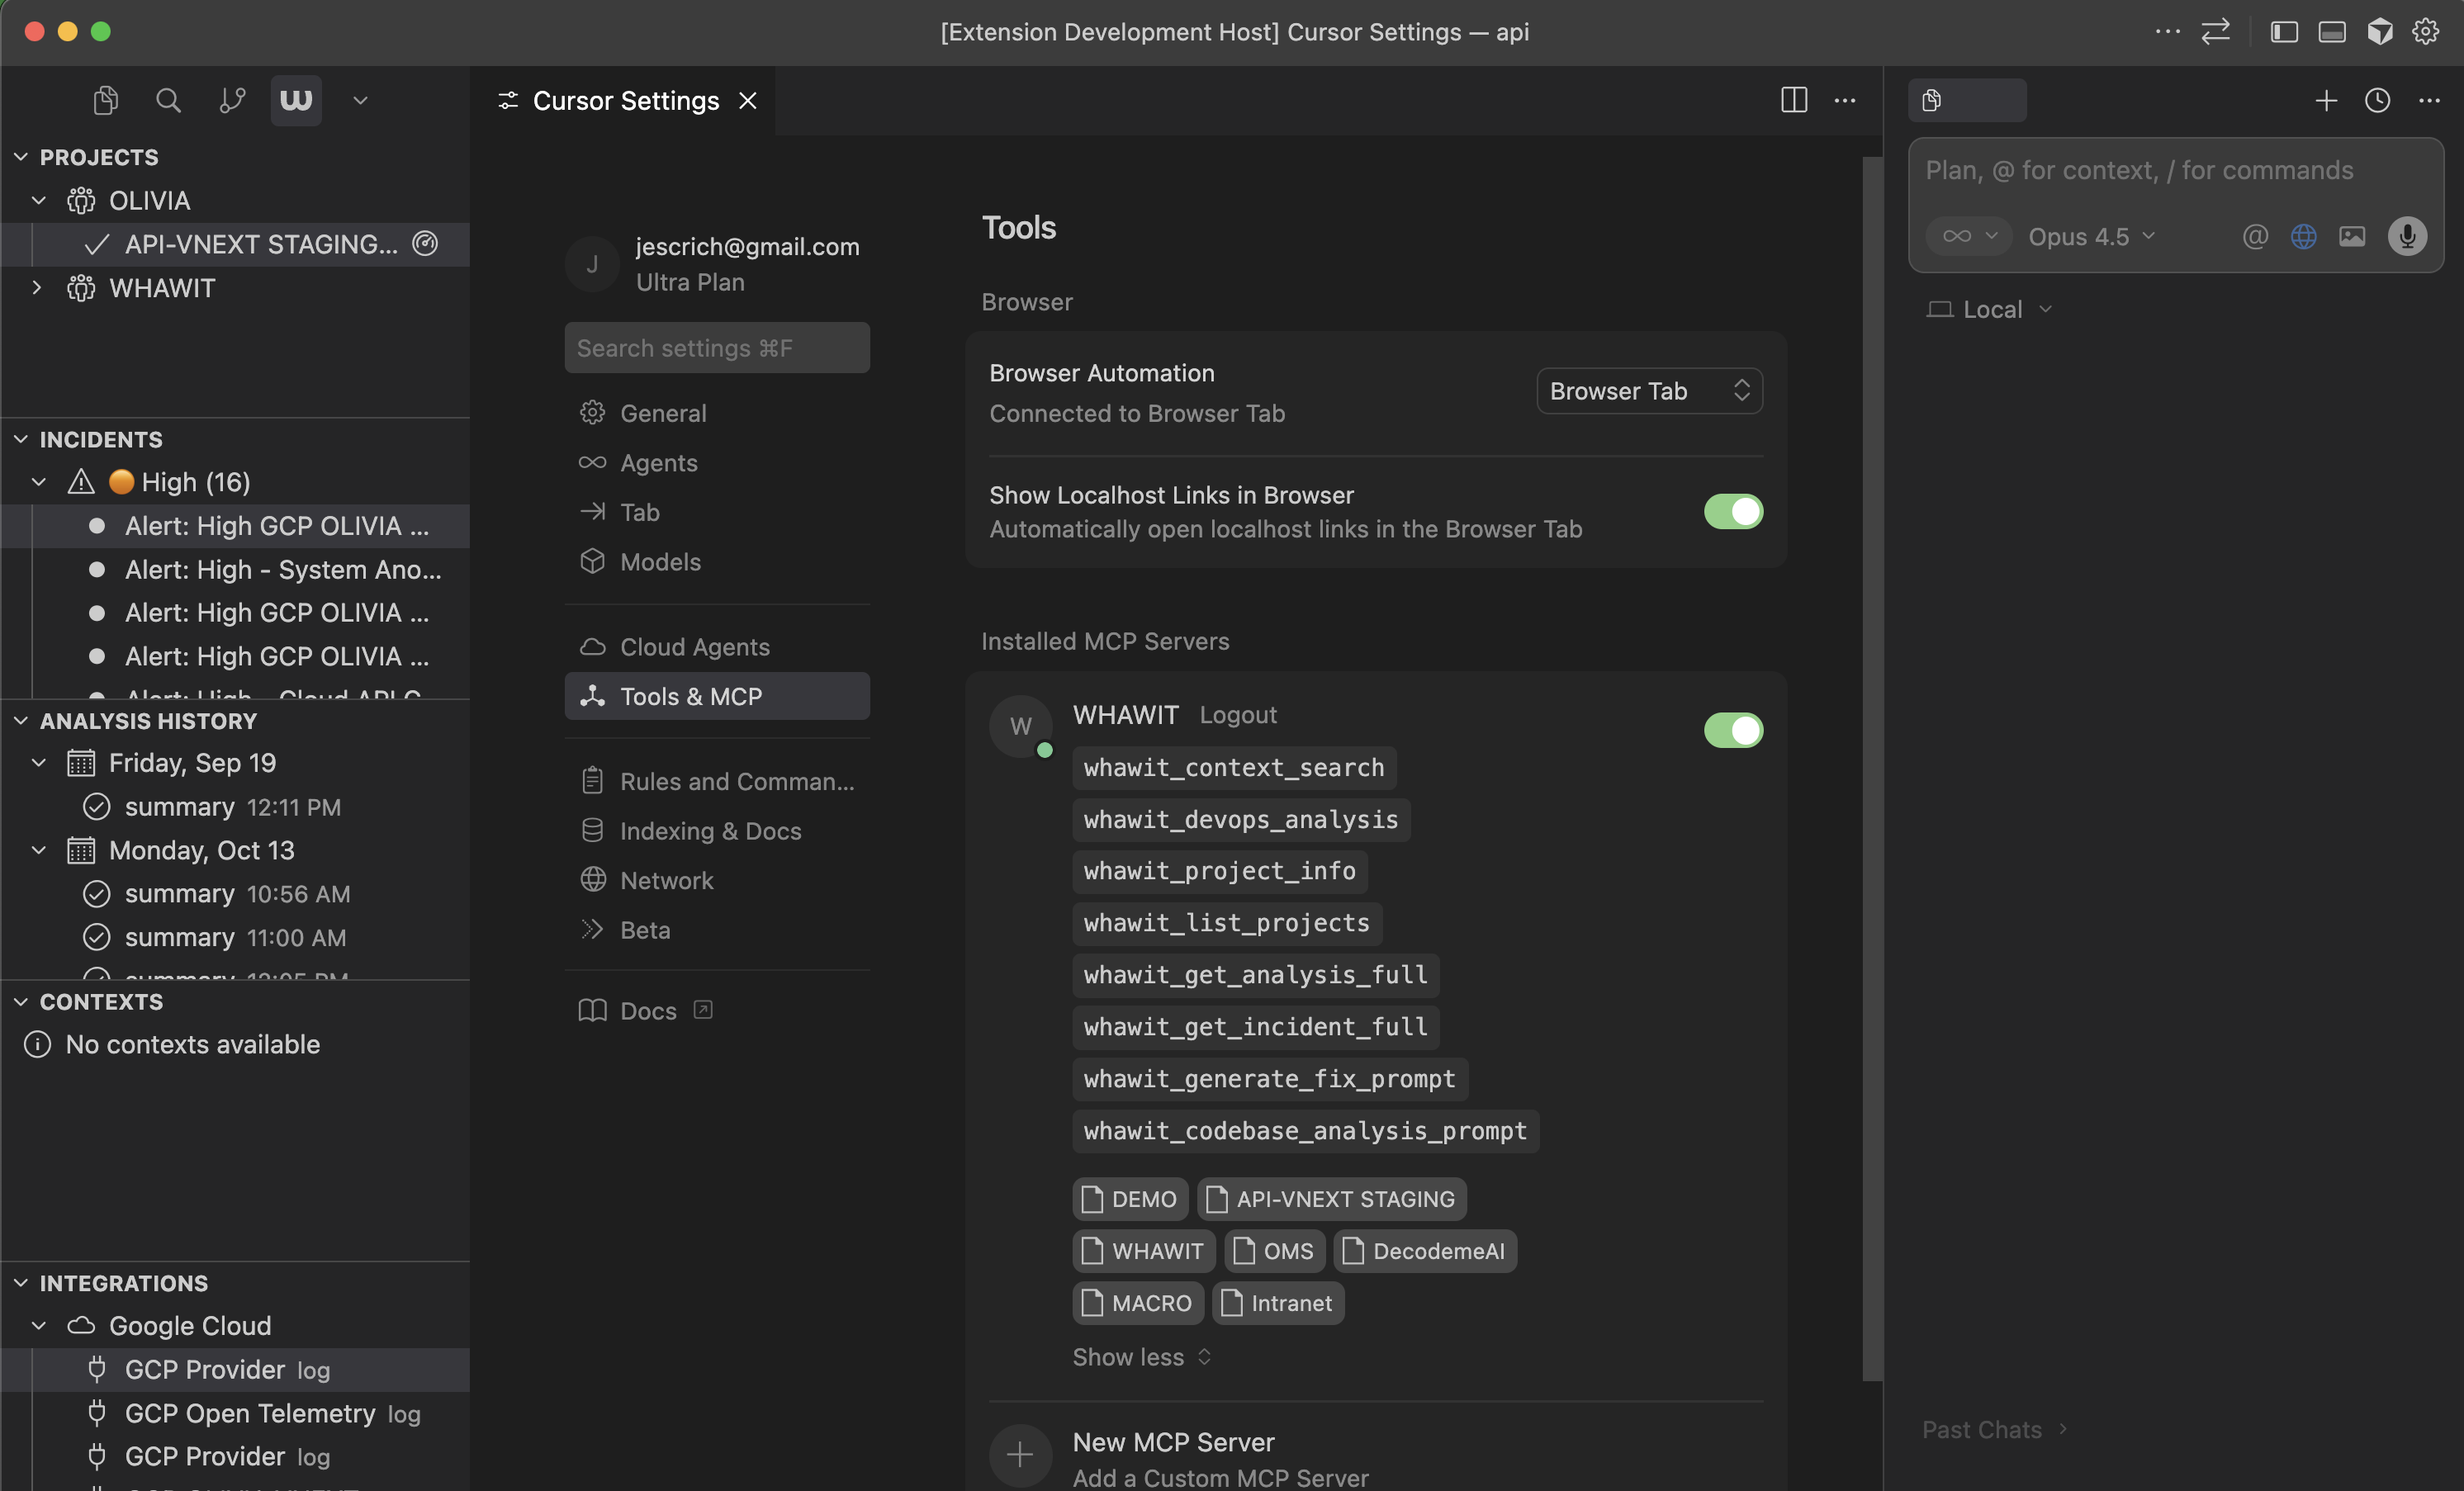
Projects
Lists all Whawit projects you have access to. Click a project to select it as your working context. The currently matched project (based on your Git remote) is highlighted.Incidents
Shows open incidents for the selected project. Each incident displays:- Severity level (critical, high, medium, low)
- Summary and service name
- Current status
- Creation timestamp
Analysis History
Displays recent DevOps analyses run on your project. Each entry shows:- Analysis title and status
- Severity assessment
- Timestamp
Contexts
Lists the project’s knowledge base contexts, including:- Repository documentation
- Architecture overviews
- User-defined technical context
Integrations
Shows connected observability providers:- Datadog
- AWS CloudWatch
- New Relic
- Google Cloud
- Sentry
- And more
Commands Reference
| Command | Description |
|---|---|
Whawit: Login | Authenticate with your Whawit account |
Whawit: Logout | Sign out and clear stored credentials |
Whawit: Open Radar Chat | Open the Radar chat panel for DevOps Q&A |
Whawit: Select Project | Manually select a Whawit project |
Whawit: Search Context | Search the project knowledge base |
Whawit: Manage Integrations | Open the integrations management panel |
Whawit: Analyze Current Workspace | Trigger an analysis of your current workspace |
Whawit: Refresh Projects | Refresh the projects list |
Whawit: Refresh History | Refresh the analysis history |
Whawit: Refresh Incidents | Refresh the incidents list |
Whawit: Open Web App | Open the Whawit web app in an embedded browser |
Whawit: Send to Copilot for Fix | Send analysis to GitHub Copilot with fix instructions |
Whawit: Copy as AI Prompt | Copy analysis as a formatted prompt for AI assistants |
Configuration
Configure the extension through VS Code settings (Ctrl+, or Cmd+,):
| Setting | Description | Default |
|---|---|---|
whawit.autoDetectProject | Auto-detect project from Git remote | true |
whawit.showStatusBar | Show Whawit status in the status bar | true |
whawit.openAnalysisIn | Where to open analysis results (embedded or external) | embedded |
AI Assistant Settings
| Setting | Description | Default |
|---|---|---|
whawit.aiAssistant.preferredFormat | Format when copying for AI (markdown, json, both) | markdown |
whawit.aiAssistant.includeRawLogs | Include raw log events in AI prompts | false |
whawit.aiAssistant.maxContextLength | Maximum context length in characters | 10000 |
Project Auto-Detection
The extension automatically detects your Whawit project by matching Git remotes. The detection process:- Reads
.git/configfrom your workspace folders - Extracts remote URLs (both HTTPS and SSH formats)
- Normalizes URLs for comparison
- Matches against repositories connected to your Whawit projects via GitHub integration
Auto-detection requires a GitHub integration configured in Whawit with access to your repository.
Troubleshooting
Extension not detecting my project
Extension not detecting my project
- Ensure your repository is connected via a GitHub integration in Whawit
- Verify the Git remote URL matches the repository URL in Whawit
- Try running Whawit: Select Project manually
- Check the Output panel (
View > Output > Whawit) for error messages
Authentication issues
Authentication issues
- Run Whawit: Logout to clear stored credentials
- Run Whawit: Login to re-authenticate
Radar Chat not responding
Radar Chat not responding
- Verify you have a project selected (check the status bar)
- Ensure the project has at least one log provider connected
- Check your network connection to
api.whawit.ai